Category: News

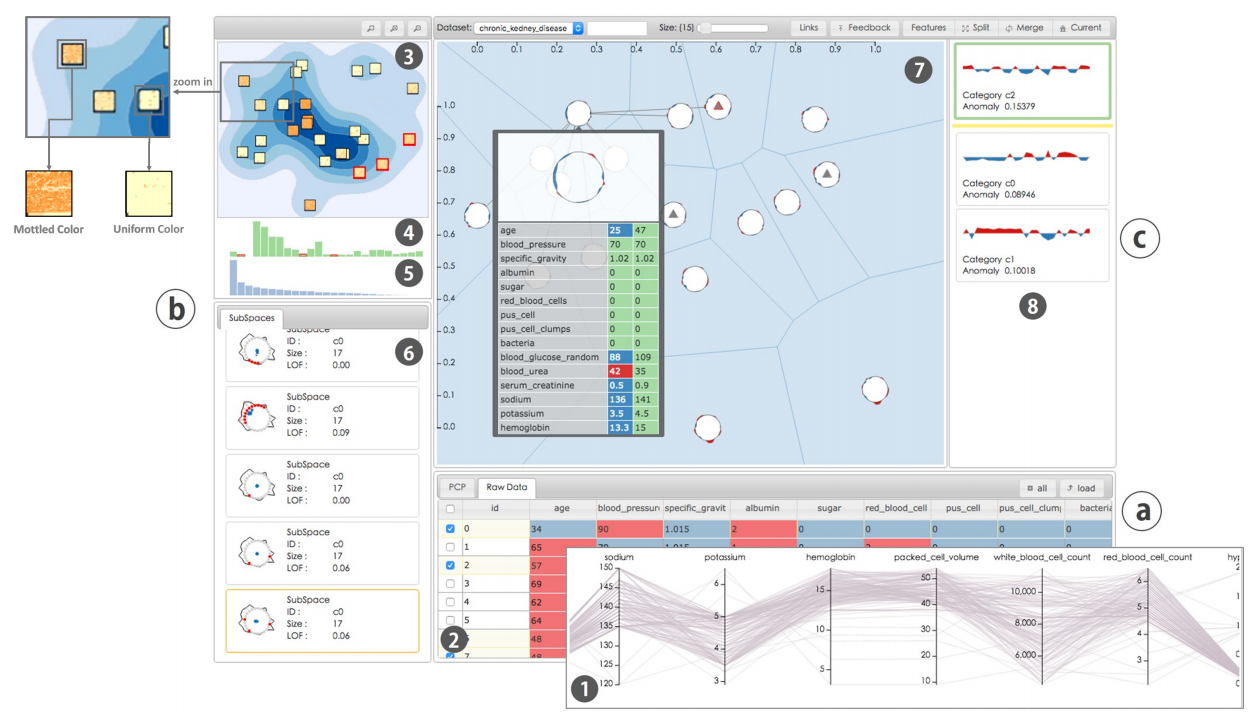
IEEE Transactions on Visualization and Computer Graphics (TVCG) just published a paper I wrote collaboratively with a number of colleagues on Rare Category Visualization.  The paper is now available online and will appear eventually in a print issue of the journal.  Here …

New IEEE TVCG Article on Rare Category Visualization Read More »

Congratulations to VACLab member Rashnil Chaturvedi who is part of the UNC team that was recently named a Finalist for the 2017 INFORMS O.R. & Analytics Student Team Competition. To quote the competition website, “Eight student teams from around the world have …

VACLab’s Rashnil Chaturvedi named an INFORMS Student Competition finalist Read More »

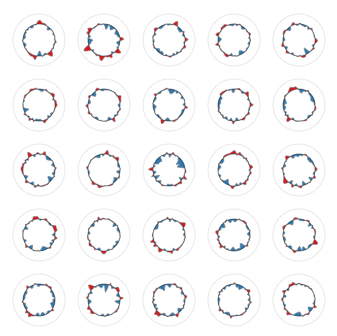
The journal Information Visualization has made our new article “Z-Glyph: Visualizing outliers in multivariate data” available online as of February 14, 2017.  You can download the paper from the Sage website by following this link. The paper describes work done in collaboration with …

Our New Article in Information Visualization Describes Z-Glyphs Read More »

I recently served as a Guest Editor for a special issue of IEEE Transactions on Multimedia focused on Visual Analytics in Multimedia (Volume 18, Issue 11, 2016).  The issue was published at the end of the year and included several exciting …

Two New Articles in IEEE Transactions on Multimedia Special Issue Read More »

Next month I’ll be attending the 2016 AMIA Annual Symposium in Chicago. AMIA will be host this year to the 2016 Visual Analytics in Healthcare Workshop.  This year’s workshop will be the 7th annual workshop, and will mark a return to …

Two papers to appear at AMIA Visual Analytics in Healthcare Workshop 2016 Read More »

My paper titled “Soft Patterns: Moving Beyond Explicit Sequential Patterns During Visual Analysis of Longitudinal Event Datasets” has been accepted as part of the IEEE VIS 2016 Workshop on Temporal & Sequential Event Analysis. The workshop is being held in conjunction …

Paper to appear at IEEE VIS 2016 Workshop on Temporal & Sequential Event Analysis Read More »

While there are a variety of Javascript libraries available for creating visualizations, the most widely used is D3.js. D3 stands for Data-Driven Documents, and at the core of D3 is a programming model in which users join data elements to document …

A Tutorial on D3.js Joins Read More »

Tagged with: , ,

I’m co-chairing a workshop at IEEE VIS this year which focuses on the visual analysis of temporal or sequential events. This has been a topic that I’ve focused on for a while now, and the organizing includes others from both …

CFP Posted for the “Event Event” at IEEE VIS 2016 Read More »

The latest issue of IEEE Computer Graphics and Applications (CG&A) contains an article I co-wrote with David Borland at RENCI about the data-driven future of healthcare and the role that data visualization and visual analytics can play in this ongoing transformation. …

Data Driven Healthcare: New Article in Latest CG&A Read More »

Risk is a difficult concept, in part because of the many ways it is measured.  Interpreting specific numbers can be unintuitive even for people who do it every day, leading to critical decisions being made based on faulty interpretations of evidence. This is a place where …

A Role for Visualization in Understanding Risk Read More »