Research Projects
Please visit my new website which is now hosted as part of the new VACLab website.
This old website will not be updated after February 2020. Moreover, this website will be retired when all content has been migrated to the new website.
I lead the Visual Analytics and Communications Lab (VACLab for short) where we study and develop visual methods for information analysis and communication. This page includes a gallery of our work, as well as descriptions of projects I completed prior to my arrival at UNC in January 2014. You can click on a project name to learn more about a specific piece of work.
Meanwhile, we’re also working on handful of exciting new projects that haven’t matured enough to post here. Watch this space to learn more as our work progresses! Better yet, join us and become part of the team!
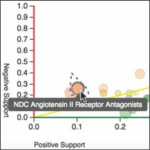
Contextual Visualization: Combating Selection Bias During Visual Analysis
We are designing, developing, and evaluating a set of Contextual Visualization Methods for exploratory data analysis which are designed to support the discovery of more robust and generalizable insights from high-dimensional data.
We are designing, developing, and evaluating a set of Contextual Visualization Methods for exploratory data analysis which are designed to support the discovery of more robust and generalizable insights from high-dimensional data.
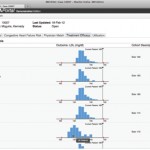
Periphery Plots
A new approach for providing focus and context in time-based charts to enable interpretation of patterns across time scales.
A new approach for providing focus and context in time-based charts to enable interpretation of patterns across time scales.
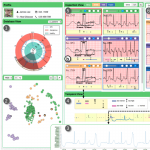
Visual Machine Learning for Anomaly and Rare Category Detection
We’ve developed visualization-based interfaces which couple closely with machine learning algorithms to aid in this type of task. This includes work with deep learning models for heart arrhythmia detection which won an Honorable Mention Award at ACM CHI 2018.
We’ve developed visualization-based interfaces which couple closely with machine learning algorithms to aid in this type of task. This includes work with deep learning models for heart arrhythmia detection which won an Honorable Mention Award at ACM CHI 2018.
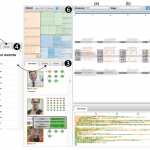
Visual Summarization and Analysis of Soft Patterns in Temporal Event Sequences
In this project, we explore novel visualization methods for clustering event sequences into threads based on tensor analysis. The threads are then visualized to display latent stage categories and evolution patterns. Interactive grouping allows threads to be grouped by similarity into time-specific clusters.
In this project, we explore novel visualization methods for clustering event sequences into threads based on tensor analysis. The threads are then visualized to display latent stage categories and evolution patterns. Interactive grouping allows threads to be grouped by similarity into time-specific clusters.
AMIA VIS Working Group Task Force on Evaluation
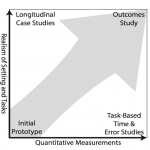
The American Medical Informatics Association (AMIA) Visual Analytics Working Group (VIS WG) Task Force on Evaluation (TFoE), chaired by Dr. Gotz, is developing a report to (1) describe the state-of-the-art in visual analytics evaluation within the healthcare domain, and (2) provide a recommendations for best practices in future medical informatics research activities.
The American Medical Informatics Association (AMIA) Visual Analytics Working Group (VIS WG) Task Force on Evaluation (TFoE), chaired by Dr. Gotz, is developing a report to (1) describe the state-of-the-art in visual analytics evaluation within the healthcare domain, and (2) provide a recommendations for best practices in future medical informatics research activities.
Visual Analysis of Pneumonia Care Plans
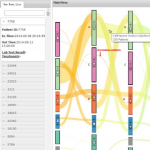
In this project, we develop a Sankey diagram-based visualization design to visually summarize care plans based on our medical collaborators’ requirements. Our tool is applied to a medical dataset of pneumonia patients collected from a Children's hospital in Shanghai, China.
In this project, we develop a Sankey diagram-based visualization design to visually summarize care plans based on our medical collaborators’ requirements. Our tool is applied to a medical dataset of pneumonia patients collected from a Children's hospital in Shanghai, China.
Tempo: Visual Analytics for Cohort Selection
This project explores how visual analytics methods can be used to create interfaces which interactively measure and visually convey to users the degree of drift in representation during iterative visual cohort selection.
This project explores how visual analytics methods can be used to create interfaces which interactively measure and visually convey to users the degree of drift in representation during iterative visual cohort selection.
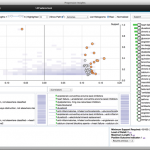
Visualizing Uncertain Labels
Data with multiple uncertain labels are common in many situations. However, existing visualization approaches often either discard the uncertainty information, or map the data to a low-dimensional subspace where their associations with original labels are obscured. We propose a novel visual technique, UnTangle, for visualizing such uncertain multi-labels.
Data with multiple uncertain labels are common in many situations. However, existing visualization approaches often either discard the uncertainty information, or map the data to a low-dimensional subspace where their associations with original labels are obscured. We propose a novel visual technique, UnTangle, for visualizing such uncertain multi-labels.
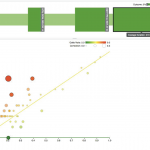
Progressive Visual Analytics for Big Data
As datasets grow and analytic algorithms become more complex, the typical workflow of analysts launching an analytic, waiting for it to complete, inspecting the results, and then re-launching the computation with adjusted parameters is not realistic for many real-world tasks. In this work we explore an alternative workflow, progressive visual analytics, which enables an analyst to inspect partial results of an algorithm as they become available and interact with the algorithm to prioritize subspaces of interest.
As datasets grow and analytic algorithms become more complex, the typical workflow of analysts launching an analytic, waiting for it to complete, inspecting the results, and then re-launching the computation with adjusted parameters is not realistic for many real-world tasks. In this work we explore an alternative workflow, progressive visual analytics, which enables an analyst to inspect partial results of an algorithm as they become available and interact with the algorithm to prioritize subspaces of interest.
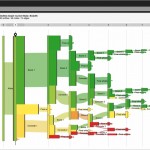
DecisionFlow: Temporal Pattern Analysis and Visualization
We explore interactive visualization and data mining techniques to uncover frequent event patterns that have strong associations with user-defined outcome measures. Though our methods can apply generally to a range of temporal event analysis problems, we focus primarily on electronic health record data and related health informatics applications.
We explore interactive visualization and data mining techniques to uncover frequent event patterns that have strong associations with user-defined outcome measures. Though our methods can apply generally to a range of temporal event analysis problems, we focus primarily on electronic health record data and related health informatics applications.
GapFlow
A visual analysis method for exploring the differences between (a) official treatment guidelines and (b) the treatments actually performed on patients. A prototype implementation has been developed to understand guideline deviations for a population of cancer patients at a major European hospital.
A visual analysis method for exploring the differences between (a) official treatment guidelines and (b) the treatments actually performed on patients. A prototype implementation has been developed to understand guideline deviations for a population of cancer patients at a major European hospital.
Iterative Visual Cohort Analysis
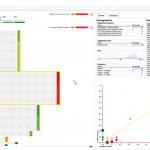
We propose a method for integrating visual data exploration and on-demand data analytics with an intuitive drag-and-drop user interface which allows clinicians to iteratively refine a group of patients for cohort selection.
We propose a method for integrating visual data exploration and on-demand data analytics with an intuitive drag-and-drop user interface which allows clinicians to iteratively refine a group of patients for cohort selection.
Outflow
Outflow provides a unique flow-based visaulization environment for exploring aggregate event sequence data. The method provides intuitive visual encodings for event sequences, timing, and associations with outcomes. Our approach also helps uncover confounding factors within high dimensional event spaces. We've applied Outflow to applications in healthcare and beyond.
Outflow provides a unique flow-based visaulization environment for exploring aggregate event sequence data. The method provides intuitive visual encodings for event sequences, timing, and associations with outcomes. Our approach also helps uncover confounding factors within high dimensional event spaces. We've applied Outflow to applications in healthcare and beyond.
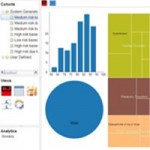
ICDA: A Platform for Intelligent Care Delivery Analytics
The Intelligent Care Delivery Analytics (ICDA) platform is a prototype system which enables a broad range of risk assessment analytics that process large collections of dynamic electronic medical data to identify at-risk patients.
The Intelligent Care Delivery Analytics (ICDA) platform is a prototype system which enables a broad range of risk assessment analytics that process large collections of dynamic electronic medical data to identify at-risk patients.
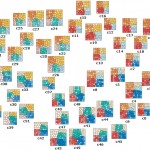
DICON
DICON is an icon-based cluster visualization that embeds statistical information into a multi-attribute display to facilitate cluster interpretation, evaluation, manipulation, and comparison.
DICON is an icon-based cluster visualization that embeds statistical information into a multi-attribute display to facilitate cluster interpretation, evaluation, manipulation, and comparison.
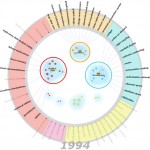
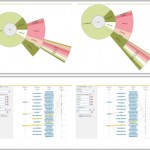
SolarMap
SolarMap is a multifaceted visual analytic technique for visually exploring topics in multi-relational data. SolarMap combines several visual techniques including topic contour clusters and interactive multifaceted keyword topic rings.
SolarMap is a multifaceted visual analytic technique for visually exploring topics in multi-relational data. SolarMap combines several visual techniques including topic contour clusters and interactive multifaceted keyword topic rings.
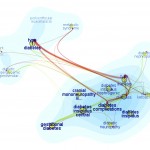
FacetAtlas
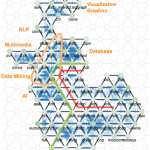
FacetAtlas is a multifaceted visualization technique for visually analyzing rich text corpora. FacetAtlas combines search technology with advanced visual analytical tools to convey both global and local patterns simultaneously.
FacetAtlas is a multifaceted visualization technique for visually analyzing rich text corpora. FacetAtlas combines search technology with advanced visual analytical tools to convey both global and local patterns simultaneously.
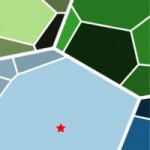
Dynamic Voronoi Treemaps
This project introduces a new technique called Dynamic Voronoi Treemaps (DVT). Our method's layout algorithm is specifically designed to support smooth, real-time animation of time varying hierarchical data while maintaining desirable aspect ratios, overcoming many key limitations of prior Voronoi-based Treemap methods.
This project introduces a new technique called Dynamic Voronoi Treemaps (DVT). Our method's layout algorithm is specifically designed to support smooth, real-time animation of time varying hierarchical data while maintaining desirable aspect ratios, overcoming many key limitations of prior Voronoi-based Treemap methods.
Behavior-Driven Visualization Recommendation
Behavior-Driven Visualization Recommendation (BDVR) is a novel approach to visualization recommendation that monitors user behavior for implicit signals of user intent to provide more effective recommendation.
Behavior-Driven Visualization Recommendation (BDVR) is a novel approach to visualization recommendation that monitors user behavior for implicit signals of user intent to provide more effective recommendation.
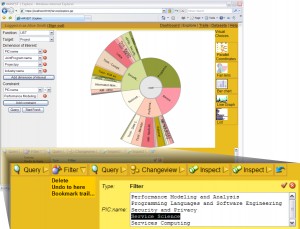
HARVEST
HARVEST is an intelligent visualization system designed to empower everyday business users to derive insight from large amounts of data. It combines three key technologies to support a complex, exploratory visualization-based analysis process without requiring users to be visualization or computer experts.
HARVEST is an intelligent visualization system designed to empower everyday business users to derive insight from large amounts of data. It combines three key technologies to support a complex, exploratory visualization-based analysis process without requiring users to be visualization or computer experts.
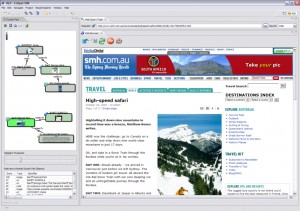
InsightFinder and ScratchPad
The InsightFinder and ScratchPad tools are extensions to the standard browser interface that are designed to capture, organize, and exploit the information discovered while performing a sensemaking task. In addition to providing a graphical note taking space with enhanced bookmarking capabilities, the technologies include context-aware algorithms that help connect portions of a user's notes to relevant portions of a webpage.
The InsightFinder and ScratchPad tools are extensions to the standard browser interface that are designed to capture, organize, and exploit the information discovered while performing a sensemaking task. In addition to providing a graphical note taking space with enhanced bookmarking capabilities, the technologies include context-aware algorithms that help connect portions of a user's notes to relevant portions of a webpage.
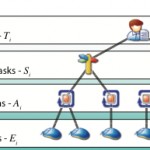
Insight Provenance Modeling
Insight provenance—a historical record of the process and rationale by which an insight is derived—is an essential requirement in many visual analytics applications. To develop a model of insight provenance, we characterize users’ visual analytic activity at multiple levels of granularity. This characterization is driven by user studies of analysis activity in various domains, ranging from travel planning to intelligence analysis.
Insight provenance—a historical record of the process and rationale by which an insight is derived—is an essential requirement in many visual analytics applications. To develop a model of insight provenance, we characterize users’ visual analytic activity at multiple levels of granularity. This characterization is driven by user studies of analysis activity in various domains, ranging from travel planning to intelligence analysis.
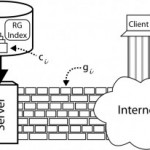
Channel Set Adaptation: Scalable and Adaptive Streaming for Non-Linear Media
The Channel Set Adaptation (CSA) project provides a framework that allows for the efficient streaming of non-linear datasets to large user groups.
The Channel Set Adaptation (CSA) project provides a framework that allows for the efficient streaming of non-linear datasets to large user groups.
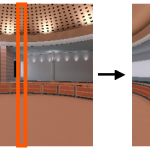
IRW: An Incremental Representation for Image-Based Walkthroughs
IRW is a new representation for image-based interactive walkthroughs which exploits spatial coherence and rearranges the input samples as epipolar images.
IRW is a new representation for image-based interactive walkthroughs which exploits spatial coherence and rearranges the input samples as epipolar images.
PixelFlex
PixelFlex is a multi-projector display system that combines multiple roughly aligned projectors into a unified high-resolution display. It includes an automated camera-based calibration process and two rendering algorithms that support interactive applications.
PixelFlex is a multi-projector display system that combines multiple roughly aligned projectors into a unified high-resolution display. It includes an automated camera-based calibration process and two rendering algorithms that support interactive applications.
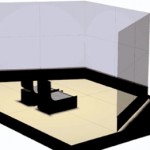
The NAVE: An Immersive Multi-Projector Display
The NAVE (Non-Expensive Automatic Virtual Environment) is a stereoscopic, multi-projector display system built from off-the-shelf components.
The NAVE (Non-Expensive Automatic Virtual Environment) is a stereoscopic, multi-projector display system built from off-the-shelf components.
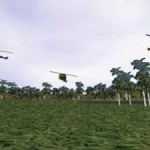
Virtual Vietnam: Virtual Reality Exposure Therapy for PTSD
This project—a joint study between Georgia Tech, Emory University, and the VA Hospital in Atlanta—developed a virtual reality-based exposure therapy system to treat Vietnam veterans suffering from post-traumatic stress disorder (PTSD).
This project—a joint study between Georgia Tech, Emory University, and the VA Hospital in Atlanta—developed a virtual reality-based exposure therapy system to treat Vietnam veterans suffering from post-traumatic stress disorder (PTSD).