Outflow
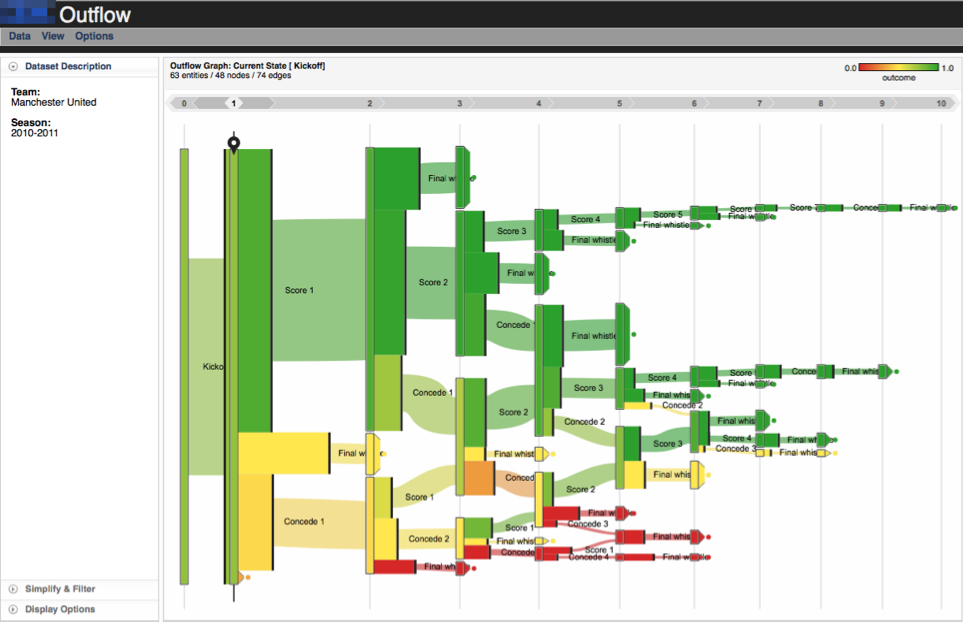
Outflow visualization of Manchester United’s 2010-2011 season.
Event sequence data is common in many domains, ranging from electronic medical records (EMRs) to sports events. Moreover, such sequences often result in measurable outcomes (e.g., life or death, win or loss). Collections of event sequences can be aggregated together to form event progression pathways. These pathways can then be connected with outcomes to model how alternative chains of events may lead to different results. Outflow is a visualization technique for interactive event sequence analysis. Outflow is designed to (1) aggregate multiple event sequences, (2) display the aggregate pathways through different event states with timing and cardinality, (3) summarize the pathways’ corresponding outcomes, and (4) allow users to explore external factors that correlate with specific pathway state transitions. Results from a user study with twelve participants show that users are able to learn how to use Outflow easily with limited training training, and that the users can perform a range of tasks both accurately and rapidly.
Publications
Adam Perer and David Gotz. Data-Driven Exploration of Care Plans for Patients. ACM CHI Extended Abstracts, Paris, France (2013).
[PDF, 2.4M]
Adam Perer and David Gotz. Visualizations to Support Patient-Clinician Communication of Care Plans. ACM CHI Workshop on Patient-Clinician Communication, Paris, France (2013).
[PDF, 2.4M]
David Gotz and Krist Wongsuphasawat. Interactive Intervention Analysis. American Medical Informatics Association Annual Symposium (AMIA), Chicago, IL (2012).
[PDF, 4.0M]
Krist Wongsuphasawat and David Gotz. Exploring Flow, Factors, and Outcomes of Temporal Event Sequences with the Outflow Visualization. IEEE Information Visualization (InfoVis), Seattle, WA (2012).
[PDF, 7.5M]
Alternate Citation: Krist Wongsuphasawat and David Gotz. Exploring Flow, Factors, and Outcomes of Temporal Event Sequences with the Outflow Visualization. IEEE Transactions on Visualization and Computer Graphics (Volume 18, Number 12, 2012).
[This article is available through the IEEE Digital Library. View the article by clicking here.]
Krist Wongsuphasawat and David Gotz. Outflow: Visualizing Patient Flow by Symptoms and Outcome. IEEE VisWeek Workshop on Visual Analytics in Healthcare, Providence, Rhode Island (2011).
[PDF, 397k]
Sch of Inform and Libr Science