The Impact of Goals
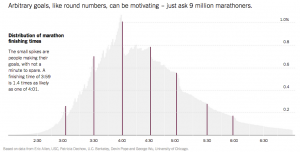
From the New York Times. Distribution of marathon completion times with red lines marking hourly milestones. Click the image to visit the original article.
An intersting article on the New York Times’ new data-based venture The Upshot highlights a study from researchers at USC, Berkeley, and the University of Chicago in which millions of marathon results were gathered together and plotted as a simple histogram.
The result? At a high level, the distribution resembled what you might expect: a roughly bell-shaped curve with a longer tail on the slow side. But the interesting part is in the figure shown to the right: miniature peaks just below the psychological barriers of 3 hours, 4 hours, 5 hours, and 6 hours. It shows the power of artificially meaningful measures. The pyschological reward of meeting that 4 hour goal pushes runners to cut their times from 4:01 to 3:59. The same time difference between 4:14 and 4:12 shows no similar allure.
Sch of Inform and Libr Science