Periphery Plots
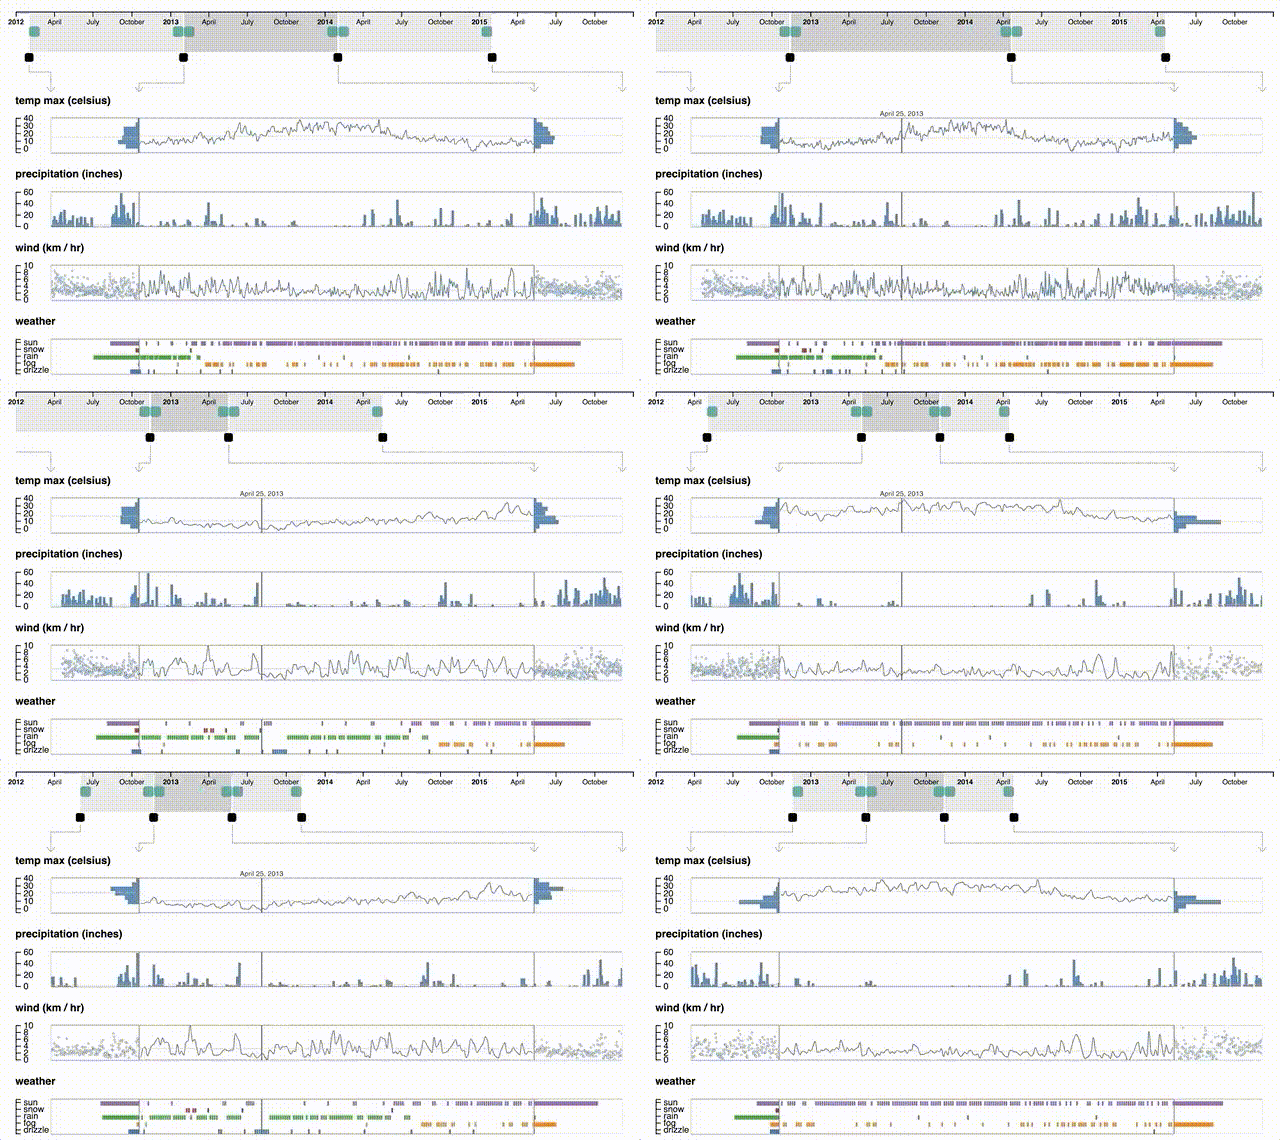
 Patterns in temporal data can often be found across different scales, such as days, weeks, and months, making effective visualization of time-based data challenging. Here we propose a new approach for providing focus and context in time-based charts to enable interpretation of patterns across time scales. Our approach employs a focus zone with a time and a second axis, that can either represent quantities or categories, as well as a set of adjacent periphery plots that can aggregate data along the time, value, or both dimensions.
The Periphery Plot concept was motivated by our work on PrecisionVISSTA, a NIH-funded effort to develop precision medicine algorithms and software focused on patient-generated health data. We also show a use case where periphery plots are used to visualized multi-variate weather data (shown in the animated image on this page).
This project is also related to our ongoing work on Contextual Visualization with support from the NSF.
Open-Source Software
Our implementation of periphery plots is available as open source software from GitHub: https://github.com/PrecisionVISSTA/PeripheryPlots
Publications
Bryce Morrow, Trevor Manz, Arlene E. Chung, Nils Gehlenborg, David Gotz. Periphery Plots for Contextualizing Heterogeneous Time-Based Charts. IEEE VIS Short Papers (2019). Preprint available on arXiv: arXiv:1906.07637.
